OUR DRINKING WATER’S ORIGIN STORY

Westminster’s water begins its journey as snow from the eastern slope of the Rocky Mountains along Clear Creek and is diverted to Standley Lake through a complex canal system. The lake stores up to 14 billion gallons of water. Half of the water belongs to the City of Westminster and the other half is reserved for Thornton, Northglenn, and other entities. Westminster’s storage in Standley Lake is enough to serve City customers for one year. While Standley Lake’s water supply varies throughout the year based on snowpack, rainfall, and seasonal weather, the lake’s water level will typically be lowest in the summer when water irrigation demands are at their peak and rainfall is minimal.
Water is a precious resource, and we make every effort to save every drop. City staff partners closely with neighboring communities to monitor Clear Creek and the canal systems

to reduce potential threats to our source water. In an emergency, the City and our partner communities have the ability to reroute contaminated water around Standley Lake until the issue can be resolved.


Seasonal changes at Standley Lake may temporarily make our water taste a little earthy.


 Why does my water taste different in the fall?
PAGE 4
Source water assessment

The Colorado Department of Public Health and Environment (CDPHE) completed a Source Water Assessment Project report (SWAP) for our water supply. It provides a screening evaluation of potential contamination that could occur in the Standley Lake watershed. It does not mean that the contamination has occurred or will occur. This information is used to evaluate the need to improve our current water treatment capabilities and prepare for future contamination threats.
A copy of the report is available by contacting our Water Quality staff at 303-658-2461 or by email at water@cityofwestminster.us
Potential sources of contamination to our source water include existing/abandoned mines, aboveground and underground leaking storage tanks, Environmental Protection Agency (EPA) abandoned contaminated sites, EPA chemical inventory/storage sites and toxic release sites, EPA hazardous waste generators, permitted wastewater discharges, solid waste sites, forests, fallow and pasture/hay, septic systems, oil/gas wells and roads, EPA Superfund Sites, commercial/ industrial/transportation, residential areas, urban recreational grasses, quarries/strip mines, gravel pits, and row crops.
PAGE 5
WATER TREATMENT
Here is how the City cleans our drinking water. Similar to most other drinking water treatment plants, the City uses four steps for treating water.
STEP 1: Flocculation and Sedimentation
Standley Lake
Water from Standley Lake enters the drinking water treatment facility and is channeled into a mixing chamber where chemicals called coagulants cause small particles such as dirt and debris to stick together, forming larger particles. As the particles continue to coagulate or stick together, they get heavier. Over time, the heavy, larger particles settle to the bottom of the settling tanks where they are removed through a bottom drain. Lime is added during flocculation for corrosion control.
STEP 2: Filtration
The cleaner, clearer water that remains flows through a series of fine media filters. Semper, the City’s oldest drinking water treatment facility, uses a 36-inch layer of sand and anthracite to filter water. It’s a lot like a three-foot-tall Brita® water filter. Built in 2001, Northwest Treatment Facility is a more modern treatment facility that uses a thin microfiltration membrane to remove fine particulates.
STEP 4: Water Delivery
STEP 3: Disinfection
After the water has been filtered of large and fine particles, a small amount of chlorine is added to eliminate bacteria or viruses.
CHLORINE
Once our drinking water has been cleaned and filtered, it is pumped to one of several water towers. Thanks to gravity, clean and safe water flows to our homes 24 hours a day, seven days a week through a network of over 545 miles of water lines.
24/7
PAGE 6
Monitoring Water Quality
Here’s a glimpse into our evaluation of water quality during the year.
WATERSHED
= manual quality control checks
15,000+ test results
10 = remote continuous monitoring stations
3,000,000+ test results
1 = 21,000 depth readings
170,000 test results
WATER TREATMENT FACILITIES
150
continuous monitoring locations throughout the treatment process
DISTRIBUTION
75 = dedicated city sample stations
1,592 test results
20 = new construction projects
200 test results
11 = water storage tanks
440 test results
PAGE 7
The History of Westminster’s Water Treatment Plants


Over the years, expansions and upgrades to Semper Water Treatment Plant were needed to meet the needs of a booming Westminster. Semper was built back in 1969 when the city’s population was approximately 20,000 people. According to the 2020 Census, Westminster is now home to about 116,000 residents.
The aerial photo of Semper in 2020, to the right, captures the 50-year-old facility that treats 65% of the City’s water over the course of a year. Northwest Treatment Facility treats the remaining 35% of the City’s drinking water supply.

NEW WATER TREATMENT FACILITY COMING IN 2028
Beginning in fall of 2023, work will begin on a new, modern water treatment facility that will reliably provide 15 million gallons of water per day (MGD). The new facility will be built on property the City recently acquired on Westminster Boulevard just north of 98th Avenue, on a site that had been previously destined for development. The new water treatment facility will allow Westminster to retire portions of an aging water treatment plant that was built over a half-century ago.
The 40-acre site will allow the City to add additional treatment technology and processes as future regulations and detection capabilities change. While the City has not seen detectable levels of per- and polyfluoroalkyl substances (PFAS) in its water supply, the new facility will be able to add new treatment systems as the technology and regulations standards are developed.
The new treatment facility will also allow the City to enhance the walking trails network by connecting portions of the site with neighboring Hyland Ponds Open Space trails.
Modern Technology for Westminster’s Water
The new facility will provide enhanced treatment processes including modern filtration design and mechanical systems to actively remove particulates from the water. Ozonation is an additional treatment process that may be included in the treatment facility based on City Council’s approval. Ozonation provides a second layer of disinfection against bacteria and viruses, reduces heavy metals including iron, manganese, and lead, and addresses pollution related to wildfire and algae blooms.
The Project Has Begun!
Design of the new water treatment facility is already underway and scheduled for completion in late 2024 after a public engagement process. The community will start to see activity on the site as early as this summer, and construction is expected to be completed in 2028.
The City will begin a public engagement process to gather additional feedback from the community later this year.
WATER TREATMENT FACILITIES PRODUCTION CAPACITY (million gallons per day) FILTRATION TYPE DISINFECTIONYEAR BUILT SEMPER 44 DirectChloramines 1969 NORTHWEST 15 MembraneChloramines 2001
PAGE 8

PAGE 9
View of the Rockies standing on the banks of Standley Lake.
PROTECTING OUR DRINKING WATER FROM WILDFIRES
The link between wildfires and our drinking water may not be obvious. When we watch the news and see crews battling wildfires hundreds of miles from our home, we don’t typically think about our drinking water. But maybe we should.
It isn’t about how much water goes to fighting the flames—it’s about the devastation and contamination the wildfire leaves behind. Westminster, in partnership with several Front Range communities, has been actively working to mitigate fires in our watershed for decades because a single wildfire could contaminate our source water for years after it’s been
the highest potential for wildfires. Armed with this knowledge, crews will be able to mitigate wildfires in our watershed.
That’s not all the City is doing to protect our ability to provide clean, safe, and affordable drinking water. We’re also building a new, modern water treatment facility. The new plant will feature bigger, more robust filters that are better equipped to handle potential contamination from a major wildfire.
The future of Westminster’s drinking water is clear: although we should all do our part to prevent forest fires, you can rest assured knowing the City works hard to make sure our water is safe and clean. extinguished.
To help keep our water clean, Westminster partnered with the Upper Clear Creek Watershed Association to complete a watershed assessment. This study identified areas with
PAGE 10
WATER SAMPLE TEST RESULTS
Westminster’s drinking water is monitored for over 100 different substances on a strict sampling schedule, and more than 1700 water samples are taken annually across the entire distribution system. The water we provide to residents and businesses must meet specific state and federal health standards. To help you better understand what is in your drinking water, we are sharing the 2022 test results for regulated substances that were detected. The “Amount We Found” that is referenced in the tables on the following pages is reported as the maximum amount detected unless otherwise noted.
The frequency of testing for individual substances is determined by CDPHE based on the likelihood that the concentrations of the substance will change over time. Some test results are for samples that were collected in 2021.
Terms & Abbreviations
Maximum Contaminant Level (MCL)
The highest level of a contaminant that is allowed in drinking water. MCLs are set as close to the MCLGs as feasible using the best available treatment technology.
Maximum Contaminant Level Goal (MCLG)
The level of a contaminant in drinking water below which there is no known or expected risk to health. MCLGs allow for a margin of safety.
Treatment Technique (TT)
A required process intended to reduce the level of a contaminant in drinking water.
Health-Based
A violation of either an MCL or TT.
Non-Health-Based
A violation that is not related to an MCL or TT.
Action Level (AL)
The concentration of a contaminant which, if exceeded, triggers treatment and other regulatory requirements.
Maximum Residual Disinfectant Level (MRDL)
The highest level of a disinfectant allowed in drinking water. There is convincing evidence that addition of a disinfectant is necessary for control of microbial contaminants.
Maximum Residual Disinfectant Level Goal (MRDLG)
The level of a drinking water disinfectant, below which there is no known or expected risk to health. MRDLGs do not reflect the benefits of the use of disinfectants to control microbial contaminants.
Nephelometric Turbidity Unit (NTU)
Measure of the clarity or cloudiness of water. Turbidity in excess of 5 NTU is just noticeable to the typical person.
Highest Level Allowed
Single or calculated value used to determine if regulatory contaminant level (e.g. MCL) is met. Examples of calculated values are the 90th Percentile, Running Annual Average (RAA) and Locational Running Annual Average (LRAA).
Violation
Failure to meet a Colorado Primary Drinking Water Regulation.
Picocuries per liter (pCi/L)
Measure of the radioactivity in water.
Parts per million = Milligrams per liter (ppm = mg/L)
One part per million corresponds to one minute in two years or a single penny in $10,000.
Parts per billion = Micrograms per liter (ppb = ug/L)
One part per billion corresponds to one minute in 2,000 years, or a single penny in $10,000,000.
Not Applicable (N/A)
Does not apply or not available.
90th percentile (P90)
The Amount We Found levels reported for lead and copper represent the 90th percentile of the total number of sites tested. The 90th percentile is equal to or greater than 90% of our lead and copper test results.
Not Detected (ND)
Indicates that the substance was not found by laboratory analysis.
PAGE 11
Alpha Emitters
How it gets in the water: Discharge of drilling wastes; discharge from metal refineries; erosion of natural deposits
Beta Emitters1
Chloramine2
How it gets in the water: Decay of natural and man-made
Combined Radium3
0.44 0.58
Table Notes
1 The MCL for Gross Beta Particle Activity (Beta Emitters) is 4 mrem/year. Because there is no simple conversions between mrem/year and pCi/L the Environmental Protection Agency considers 50 pCi/L to be the level of concern for Gross Beta Particle Activity (Beta Emitters).
2 The Amount We Found for Chloramine represents the average of all individual sample results collected in the distribution system. 100% of the samples collected at the entry points to the distribution system met the TT requirement that for no more than four consecutive hours the chloramine result must be at least 0.2 mg/L.
3 Radium-228 is an individual alpha particle activity emitter, however it is not included in the gross alpha particle activity (Apha Emitters) and is measured separately. Radium-228 sample results are combined with radium-226 sample results for the purposes of determining compliance.
(pCi/L) Barium (ppm) Amount We Found 0.68 Year Samples Collected Health Goal (MCLG) Highest Level Allowed (MCL) Lowest Amount Detected 2021 0 15 0.55 Amount We Found 0.048 Year Samples Collected Health Goal (MCLG) Highest Level Allowed (MCL) Lowest Amount Detected 2022 2 2 0.046 No Violation Highest Amount Detected 0.68 No Violation Highest Amount Detected 0.048
How it gets in the water: Erosion of natural deposits
(as Chlorine) (ppm)
(pCi/L) Amount We Found Year Samples Collected Health Goal (MCLG) 2021 0 Amount We Found Year Samples Collected Health Goal (MRDLG) 2022 4 4.9 Highest Level Allowed (MCL) Lowest Amount Detected 50 2.3 2.05 Highest Level Allowed (MRDL) Lowest Amount Detected 4 1.34 No Violation Highest Amount Detected 4.9 No Violation Highest Amount Detected 2.50
microbes
How it gets in the water: Water additive used to control
(ppm)
deposits Fluoride
(pCi/L) Year Samples Collected 2021 Year Samples Collected 2022 Amount Amount Health Goal (MCLG) 0 Health Goal (MCLG) 4 We Found We Found Highest Level Allowed Highest Level Allowed 5 4 (MCL) (MCL)
Lowest Amount Detected 0.14 Lowest Amount Detected 0.57 No Violation Highest Amount Detected 0.58 How it gets in the water: Erosion of natural deposits No Violation Highest Amount Detected 0.44 How it gets in the water: Erosion of natural deposits
PAGE 12
Haloacetic Acids – HAA4
Total Trihalomethanes – TTHM4
How it gets in the water: Byproducts of drinking water
Total Organic Carbon4
How it gets in the water: Byproducts of drinking water
Turbidity5
Turbidity
Table Notes
4 Total Organic Carbon is regulated as quarterly running annual average (RAA). HAA and TTHM are regulated as locational running annual average (LRAA). The Amount We Found represents the highest RAA or LRAA, and the Range Low-High represents individual sample results.
5 Turbidity is measured at the water treatment plant to assess cloudiness of the water as a good indicator of the effectiveness of the filtration process. The highest turbidity result was recorded in January 2022.
(ppb)
(ppb) Amount We Found Year Samples Collected Health Goal (MCLG) 2022 NA Amount We Found Year Samples Collected Health Goal (MCLG) 2022 NA 11.4 Highest Level Allowed (MCL) Lowest Amount Detected LRAA <60 6.9 38.0 Highest Level Allowed (MCL) Lowest Amount Detected LRAA < 80 27.1 No Violation Highest Amount Detected 14.5 No Violation Highest Amount Detected 50.9
disinfection
disinfection
(NTU)
(ppm) Year Samples Collected 2022 Year Samples Collected 2022 Amount We Found Amount Health Goal (TT) NA Health Goal (TT) NA We Found Highest Level Allowed (TT) RAA <2 no Highest Level Allowed (TT) sample 1.56 Lowest Amount Detected 1.44 above 0.3 0.038 No Violation Highest Amount Detected 1.71 How it gets in the water: Naturally present in the environment Lowest Amount Detected 0.014 No Violation Highest Amount Detected 0.038 How it gets in the water: Soil runoff
(Lowest monthly percent of samples meeting limit) Uranium (ppb) Year Samples Collected 2022 Year Samples Collected 2021 Amount Amount Health Goal (TT) NA Health Goal (MCLG) 0 We Found We Found 95% of Highest Level Allowed 30 Lowest Level Allowed (TT) samples (MCL) 100 0.90 <0.1 Lowest Amount Detected 0.32 Lowest Amount Detected 100 No Violation Highest Amount Detected 0.90 No Violation Highest Amount Detected 100 How it gets in the water: Erosion of natural deposits How it gets in the water: Soil runoff
PAGE 13
Copper6
6 Copper and lead were measured at residential taps throughout the city in 2021. The Action Level (AL) for lead and copper applies to the 90th percentile (P90) of all samples collected for each contaminant (e.g. 90% of all sample results for copper must be below 1.3 ppm). Amount We Found represents the 90th percentile and the Range Low-High represents individual sample results. One sample exceeded the AL for lead at 23 ppb which was traced to the homeowner sampling a water faucet that did not meet sampling criteria. The AL was not exceeded for copper at any location.
Additional Test Results
Some substances present in the drinking water are not strictly regulated because they do not pose a health risk Total
Additional Drinking Water Data for 2022
to the general population. We include this information for customers who inquire about water quality data for Conductivity
- 265
pH (s.u.) 8.3 - 8.9
- 451 µS/cm beer brewing or optimizing aquariums, water softeners or dishwashers. These test results are for samples collected in 2022.
Alkalinity (as CaCO3) 49 - 63 ppm
Total Hardness 108 - 138 ppm (approximately 6 (as CaCO3) to 8 grains per gallon)
Sodium 27 - 31 ppm
Ammonia (as N) 0.33–0.67 ppm
(ppm) Lead6 (ppb) Amount Year Samples Collected 2021 Amount Year Samples Collected 2021 We Found Health Goal (AL) NA We Found Health Goal (AL) NA P90 = 0.15 Highest Level Allowed (AL) Lowest Amount Detected P90=1.3 0.032 P90 = 2 Highest Level Allowed (AL) Lowest Amount Detected P90=15 ND No Violation Highest Amount Detected 0.21 How it gets in the water: Corrosion of household plumbing; erosion of natural deposits No Violation Highest Amount Detected 23 How it gets in the water: Corrosion of household plumbing; erosion of natural deposits Nickel (ppb) Chromium (ppb) Year Samples Collected 2022 Year Samples Collected 2022 Amount Amount We Found Health Goal (MCLG) NA Health Goal (MCLG) 100 We Found Highest Level Allowed Highest Level Allowed NA 100 (MCL) (MCL) 1.5 0.98 Lowest Amount Detected ND Lowest Amount Detected ND No Violation Highest Amount Detected 1.5 How it gets in the water: Corrosion of plumbing materials No Violation Highest Amount Detected 0.98 How it gets in the water: Discharge from steel and pulp mills; erosion of natural deposits
Table Notes
Dissolved
ANALYTE CONCENTRATION RANGE 199
ppm
331
Solids
PAGE 14
WHAT YOU NEED TO KNOW ABOUT LEAD
If present, elevated levels of lead can cause serious health problems especially for pregnant women and young children. It is possible that lead levels at your home may be higher than other homes in the community as a result of materials used in your home’s plumbing. If you are concerned about lead in your water, you may wish to have your water tested. When your water has been sitting for several hours, you can minimize the potential for lead exposure by flushing your tap for 30 seconds to 2 minutes before using water for drinking, cooking or preparing baby formula. You can also use a filter certified by an American National Standards Institute accredited certifier to reduce lead in drinking water.
Additional information on lead in drinking water, testing methods, and steps you can take to minimize exposure is available from the Safe Drinking Water Hotline 1-800-426-4791 or at epa.gov/ground-water-and-drinking-water.
Look out for our most vulnerable neighbors
Some people may be more vulnerable to contaminants in drinking water than the general population. Immunocompromised persons such as persons with cancer undergoing chemotherapy, persons who have undergone organ transplants, people with HIV-AIDS or other immune system disorders, some elderly, and infants can be particularly at risk of infections. These people should seek advice about drinking water from their health care providers.


NO LEAD FOUND IN SURVEY OF ALL SINGLE FAMILY RESIDENTIAL SERVICE LINES
In 2019, the City inspected the water service lines for single family homes to verify that pipes on either side of the water meter were made of copper and not lead. CDPHE and the EPA have established new rules about needing a second point of verification that there are no lead service lines. As we work with our partners at the State you may hear from us as we continue to verify that no lead was found for our single-family residential lines.
PAGE 15
How much are we talking about?
Parts Per Million (ppm)
1 drop in a hot tub is equal to 1 ppm
Parts Per Billion (ppb)
1 drop in an Olympic-size swimming pool is equal to 1 ppb
Non-Health-Based Violation
Parts Per Trillion (ppt)
1 drop in a 6-acre lake is equal to 1 ppt
We are required to monitor your drinking water for specific contaminants on a regular basis. Results of regular monitoring are an indicator of whether or not our drinking water meets health standards. During January 1–31, 2022 we did not complete all monitoring or testing for chlorine residual and therefore cannot be sure of the drinking water quality during that time.
During the month of January 2022, the City of Westminster’s Northwest Water Treatment Facility was required to collect a total of 186 chlorine residual samples from the drinking water being pumped from the plant and into the distribution system. Though samples were collected and analyzed each day; due to online instrument failure only 171 samples were collected and analyzed. This resulted in a drinking water monitoring violation, which requires this public notification as directed by the Colorado Department of Public Health and Environment (CDPHE).
What does this mean? What should I do? This monitoring error was a violation, but did not impact public health so customers do not need to seek alternative water supplies or take further actions. If a situation arises where the water is no longer safe to drink, you will be notified within 24 hours.
What is being done? This violation was resolved by January 31, 2022 through enhanced, daily instrument verification procedures and improvements to online instrument programming sensitivity which will alert staff to a malfunction.
You may contact the City’s Utilities Water Treatment staff at 6575 W. 88th Avenue, Westminster, CO, 80031 or 303-658-2500 for additional information regarding this public notice.
Please share this information with all the other people who drink this water, especially those who may not have received this notice directly (for example, people in apartments, nursing homes, schools, and businesses). You can do this by posting this notice in public places or by distributing copies.
PAGE 16
For more information about contaminants and potential health effects, or to receive a copy of the U.S. Environmental Protection Agency (EPA) and the U.S. Centers for Disease Control (CDC) guidelines on appropriate means to lessen the risk of infection by Cryptosporidium and microbiological contaminants, call the EPA Safe Drinking Water Hotline at 1-800-426-4791 or visit cdc.gov/parasites/crypto.
Substances that could be in source water
In order to ensure that drinking water is safe, CDPHE prescribes regulations that limit the amounts of certain contaminants in water provided by public water systems. The Food and Drug Administration regulations establish limits for contaminants in bottled water that must provide the same level of protection for public health.
The water sources for tap and bottled water include rivers, lakes, streams, ponds, reservoirs, springs, and wells. As water travels over the surface of the land or underground, it dissolves naturally occurring minerals including potentially radioactive material, and it can pick up substances resulting from the presence of animals or from human activity. Contaminants that may be present in source water include:
Microbiological contaminants: Viruses and bacteria that may come from sewage treatment plants, septic systems, agricultural livestock operations, and wildlife.

Inorganic contaminants: Salts and metals, which can be naturally occurring or result from urban storm water runoff, industrial or domestic wastewater discharges, oil and gas production, mining, or farming.
How the EPA sets limits
The Environmental Protection Agency (EPA) studies pollutants and their impacts to the environment and people to determine the Maximum Contaminant Level (MCL). Every water utility, including Westminster, is required by law to not exceed the MCL.
The Maximum Contaminant Level Goal (MCLG) is the level at which there are no known effects on a person’s health with an additional margin for safety. The MCL is set as close as possible to the goal.
Sometimes the MCL is higher than the MCLG. This is because of one of three possible reasons:
(1) The technology needed to measure such small quantities of the MCLG is not available;
(2) The technology needed to remove the pollutant or reduce it to the MCLG is not available yet; or
(3) The cost of treating the pollutant to the MCLG outweighs the potential benefit of a lowered standard.
Pesticides and herbicides: May come from a variety of sources, such as agriculture, urban storm water runoff and residential uses.
Radioactive contaminants: Can be naturally occurring or a result of petroleum production and mining activities.
Organic chemical contaminants: Synthetic and volatile organic chemicals, which are byproducts of industrial processes and petroleum production, and also may come from gas stations, urban stormwater runoff, and septic systems.
DID YOU KNOW?
All drinking water, including bottled water, may reasonably be expected to contain at least small amounts of some contaminants. The presence of contaminants does not necessarily indicate that the water poses a health risk.
For more information about contaminants and potential health effects, call the U.S. EPA’s Safe Drinking Water Hotline at 800-426-4791 or visit epa.gov/ground-water-and-drinking-water
PAGE 17
QWhat should I know about fluoride in the water?
AThe City of Westminster does not add fluoride during the treatment process. The 0.58 part per million fluoride level in the drinking water is from natural sources in the environment and is less than the recommended 0.7 part per million concentration established by the U.S. EPA for drinking water.
QWhat if I need help paying my water bill?
AWe understand that financial hardship happens, and we are here to support you with multiple opportunities. Income-qualified residents can view all programs and apply for assistance online at cityofwestminster.us/WaterBillAssistance or call 303658-2392 with any questions. Programs include:
Bill Credit Program: This program provides a $180 credit applied over a 12- month period in $15/month increments for residents who meet the income guidelines. If residents already qualify for the Low Income Energy Assistance Program (LEAP), they will also automatically qualify for this program.
Hardship Program: This program offers a one-time credit (up to $750) to residents who may been experiencing short-term difficulties paying their water bill due to a temporary interruption of income, such as an injury or medical emergency.
Indoor Efficiency Program: This program provides up to two free high-efficiency toilets and free indoor water-use inspections to income-qualified homeowners.
Emergency and Essential Repair Program: This program is available to income-qualified homeowners who may need emergency or essential home repairs up to $5,000. Eligible repairs include addressing leaking indoor plumbing.
The State of Colorado also offers water assistance through its LIHWAP program (administered through LEAP)
Low Income Household Water Assistance Program (LIHWAP): Financial assistance for income-qualified residents is also available from the state’s LEAP and LIHWAP programs. Residents can find more information here: cdhs.colorado.gov/leap
QIs there PFAS in Westminster’s drinking water?
AWestminster tested untreated source water and treated water for 18 PFAS compounds in March 2020. No PFAS compounds were detected in any of the treated water samples. The City is scheduled to analyze the finished water quarterly in 2024 for 29 PFAS compounds as required by the EPA for UCMR5.
PFOA and PFOS are fluorinated organic chemicals that are part of a larger group of chemicals referred to as perfluoroalkyl substances (PFASs). PFOA and PFOS have been the most extensively produced and studied of these chemicals. The U.S. EPA proposed lowering the limit for PFAS substances earlier this year to a level it can be reliably measured at four parts per trillion – the equivalent of four drops for a 6-acre lake. The City of Westminster continues to work in partnership with the CDPHE and the EPA. We are monitoring and complying with new guidelines as they are established. PFASs have been used to make carpets, clothing, fabrics for furniture, paper packaging for food, and other materials (e.g., cookware) that are resistant to water, grease, or stains. They are also used for firefighting at airfields and in a number of industrial processes. B ecause these chemicals have been used in an array of consumer products, most people have been exposed to them. Between 2000 and 2002, PFOS was voluntarily phased out of production in the U.S. by its primary manufacturer. In 2006, eight major companies voluntarily agreed to phase out their global production of PFOA and PFOA-related chemicals, although there are a limited number of ongoing uses. Scientists have found PFOA and PFOS in the blood of nearly all the people they tested, but these studies show that the levels of PFOA and PFOS in blood have been decreasing. While consumer products and food are a large source of exposure to these chemicals for most people, drinking water can be an additional source in the small percentage of communities where these chemicals have contaminated water supplies. Such contamination is typically localized and associated with a specific facility, for example, an industrial facility where these chemicals were produced or used to manufacture other products or an airfield at which they were used for firefighting.
DRINKING WATER FAQS
PAGE 18
Utilites Specialist I, Public Works And Utilities
Public Works and Utilities crews complete maintenance and flushing of all 4,482 fire hydrants in the city each year to ensure reliability and distribution water quality.
 Dave,
Dave,
PAGE 19
WATER SUPPLY AND CONSERVATION
Although water is a precious and limited resource across the West, it is especially important in Colorado. Our four river basins — the Colorado, Platte, Rio Grande, and Arkansas — are the water source for 17 downstream states. Thanks to years of careful planning and strategic investments, Westminster has enough water for its current and future water needs as long as development continues in line with the City’s Comprehensive Plan, the Wattenberg Reservoir is completed, and water conservation trends continue.
Drought remains the greatest threat to the city’s water supply. Conservation measures by our residents and businesses continue to be the best way for the city to secure its water supply.
Visit www.cityofwestminster.us/conservation to learn more about programs to reduce water usage.
DID YOU KNOW?
Westminster’s average residential customer uses four times more water in a summer month than in a winter month to water their lawn and other outdoor irrigation needs.
Save Water, Save Money, and Get a Yard Remodel!
The City offers a number of programs to help residents reduce their outdoor water usage. The City will pay up to $750 towards the cost of removing lawn and replacing it with Colorado-friendly plants. The City also sells discounted water wise garden kits and provides FREE irrigation system consultations.
Upgrade to a Waterwise Yard


The City is offering residents up to $750 toward transforming your thirsty lawn into a beautiful, waterwise landscape. We have partnered with Resource Central to make the process as easy as possible.
Garden In A Box
Garden In A Box kits are professionally designed for Colorado yards, and can help you save thousands of gallons of water each year compared to a traditional grass lawn. Starting at just $119, Garden In A Box kits are beautiful, affordable, and easy to plant.
Slow the Flow Irrigation Consultation
Take the guesswork out of watering your lawn with a free sprinkler consultation from Westminster and Resource Central. Participants save an average of $175 off total summertime water bills. Register now to schedule your appointment.

Waterwise Webinars
Please join us for over 20 free webinars led by Colorado low-water landscape experts. Some of our favorite upcoming seminars are focused on helping beginners get started, such as “New to Colorado Landscaping,” and “Planting for Pollinators.”

Visit www.resourcecentral.org to learn more about and sign up for these programs. PAGE 20
Please Help Us Keep Our Water Clean
The City has separate sanitary and storm sewer systems. Separate systems have two different pipes. One pipe carries sanitary sewage to the wastewater treatment facility. The other pipe carries stormwater (rain) from storm drains to local streams, rivers and lakes, such as Big Dry Creek with little or no treatment. Therefore, it’s critical you don’t throw anything into the storm sewer.
WHAT IF I NEED HELP PAYING MY WATER BILL?
We understand that financial hardships happen, and we are here to support you. Income qualified residents can apply for assistance online at www.cityofwestminster.us/ WaterBillAssistance Please call 303-658-2392 for more information.
Westminster’s new customer portal is here!
Westminster’s new customer portal offers residents and customers the ability to monitor hourly water consumption and receive emergency leak alerts via email. You can compare past water use, pay your water bill, and learn about water effciency programs that could help you save water and money.


Data Dashboard
The data dashboard allows customers to view their current month’s water bill in comparison to the same month of last year in a friendly, visual dashboard.
Secure Billing & Payments
Track billing history, set bill payment alerts, and make bill payments online.
Receive Leak Alerts
Sign up for automatic emergency email notifcations when a potential leak is detected at your home or business.
www.cityofwestminster.us/WestyWater
Monitor Usage
View your hourly, daily, and monthly water consumption to identify ways to conserve water and save money.
Fix oil leaks (don’t pour used oil down drains!)
Pick up pet poop
Use fertilizers sparingly
Compost leaves Use commercial car washes
PAGE 21
THIS IS YOUR WATER SYSTEM: GET INVOLVED!
Have a question or concern? Feel free to reach out directly to the Water Quality team by calling 303-658-2461 or by email at water@cityofwestminster.us.
City Council Meetings
Residents are invited to provide comments about drinking water quality, budgets, and plans during City Council meetings. Westminster City Council meets in regular session on the second and fourth Mondays of each month at 7:00 p.m. in the Council Chambers at Westminster City Hall, 4800 W. 92nd Avenue. Please refer to the City’s website at www.cityofwestminster.us for additional information including new ways to watch the council meetings and submit public comment via email and voicemail.

Social Media
www.facebook.com/cityofwestminstercolorado
www.nextdoor.com/city/westminster--co/
www.twitter.com/westminsterco
www.instagram.com/westminster.colorado/
www.youtube.com/@WestminsterCO
Water Infrastructure Projects Update
Infrastructure projects are almost entirely funded by your monthly water bill. To learn about what we are doing to keep our drinking water clean and safe, as well as potential impacts of our construction projects, please visit www.cityofwestminster.us/Water
The City of Westminster’s Utilities Operations Division maintains the City’s water mains. If you suspect problems in the water system such as main breaks, service line leaks, frozen meters, or pressure issues, notify us at 303-658-2500, 24 hours a day, seven days a week.
PAGE 22

WWW.CITYOFWESTMINSTER.US 4800 West 92nd Ave. | Westminster CO, 80031

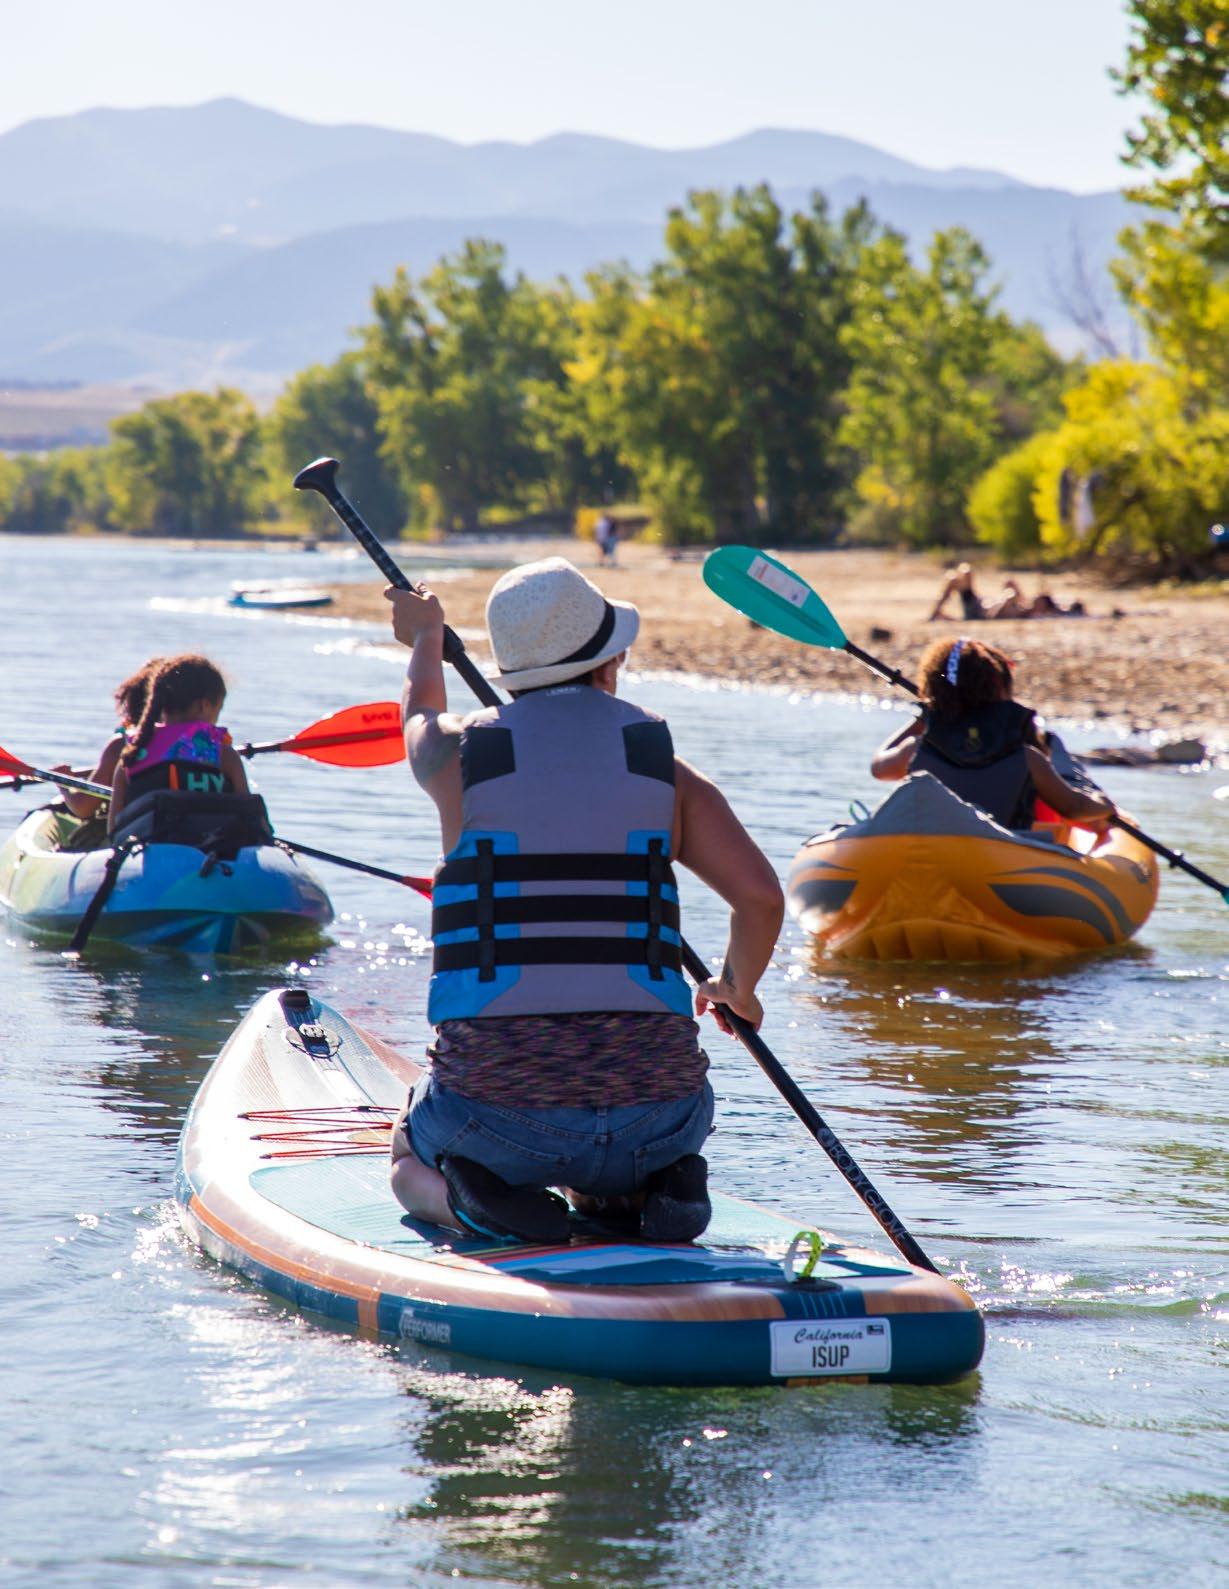
 Jessica, Senior Water Quality Analyst, Public Works And Utilities